

Discover the top 10 stock charts to watch this month with Grayson Roze and David Keller, CMT. They break down breakout strategies, moving average setups, and technical analysis strategies using relative strength, momentum, and trend-following indicators. This analysis covers key market trends that could impact your trading decisions. You don’t want to miss these insights into market dynamics and chart ...

When you’re lost in the woods, you reach for a compass to find true north. In the markets, it’s not so simple, as the landscape is always shifting. If there is a “true north” in this terrain, it might be better understood as a characteristic—strength and momentum over time, rather than a single stock or sector. With sentiment muddled and ...
In this video, Joe demonstrates how to use the 18-day and 40-day moving averages to identify trade entry points, assess trend direction, and measure momentum. He breaks down four key ways these MAs can guide your trading decisions—especially knowing when to be a buyer. Joe also analyzes commodities, noting recent weakness, and highlights key technical levels to watch on the ...
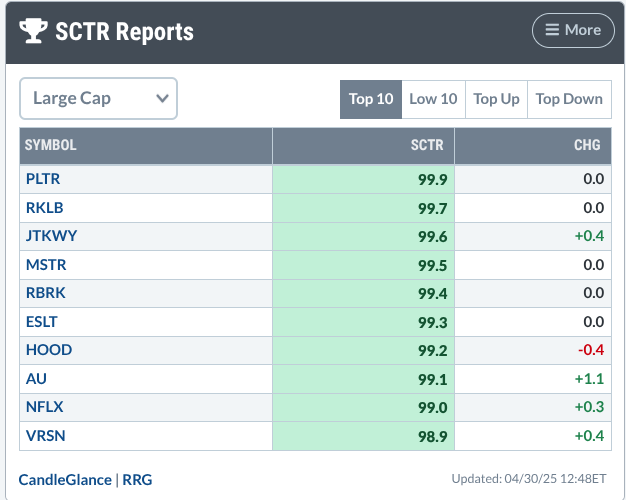
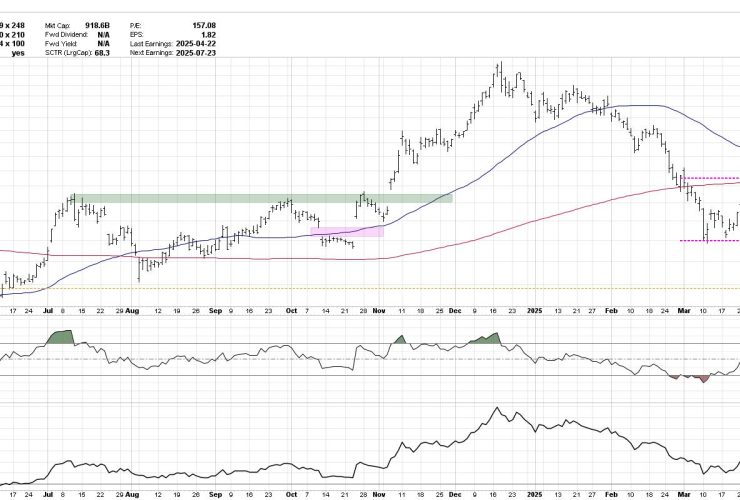
Thursday’s market rout, triggered by the grim arithmetic of a negative first-quarter GDP, hardly provides fertile ground for a ‘risk-on’ appetite. Yet some stocks continue to defy the mood, climbing despite the volatility and uncertainty weighing on investor sentiment. One such stock is Palantir Technologies, Inc. (PLTR), which has consistently ranked in or near the Top 10 Large Cap stocks ...
In this video, Julius analyzes current asset class rotation, revealing why stocks in the lagging quadrant may signal continued market weakness. By combining sector rotation trends—particularly strength in defensive sectors—with SPY seasonality, Julius builds a compelling case that downside risk in the S&P 500 may outweigh upside potential in the current environment. This video was originally published on April 30, ...
Grow your trading account using proven options strategies, right from your StockCharts ChartLists, with the help of this powerful educational webinar! In this session, Tony Zhang, Chief Strategist of OptionsPlay, will show you how to: Scan your ChartLists for top-performing trade setupsIdentify income-generating and directional opportunitiesUse OptionPlay’s real-time Strategy Explorer to rank and compare tradesAlign technical analysis with the best ...

Speaking overall, the stock market hasn’t changed course after last week’s bounce; the upside momentum is still here, albeit acting a little tentative. One piece of news that may have helped move the market higher on Tuesday, though, was President Trump’s decision to scale back on auto tariffs. Investors seem to be looking forward to any news of progress on ...

If you’ve been exploring ways to take your options trading to the next level, the OptionsPlay Add-On for StockCharts is the single most impactful upgrade you can make. And now, it’s even better. Courtesy of a big and highly-anticipated update, the Strategy Center within the OptionsPlay Add-On now runs directly on your ChartLists—allowing you to discover optimal Covered Calls, Short ...
Shares of Tesla Inc. (TSLA) have been decidedly rangebound over the last two months, bouncing between support around $220 and resistance at $290. The recent price action, as well as the momentum characteristics, have confirmed this sideways trend for TSLA. How the stock exits this consolidation phase could make all the difference! Today we’ll look at this intriguing technical setup, ...

Today, Carl and Erin made a big announcement! They are retiring at the end of June so today was the last free DecisionPoint Trading Room. It has been our pleasure educating you over the years and your participation in the trading room has been fantastic! Be sure and sign up to follow the DecisionPoint Blog on StockCharts.com where we do ...