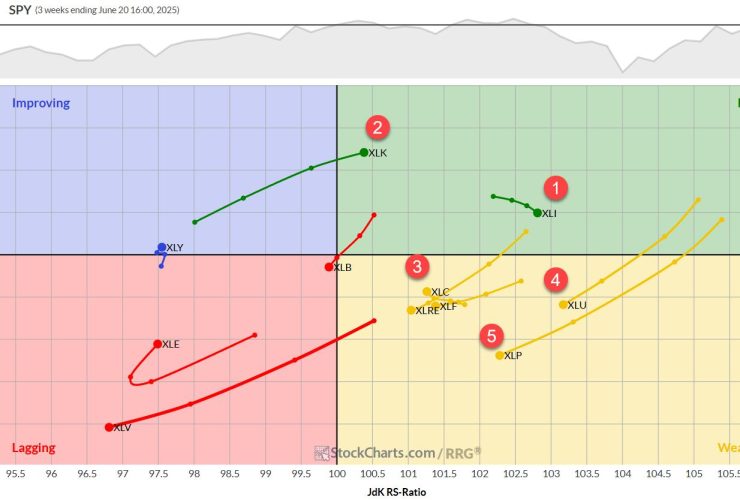
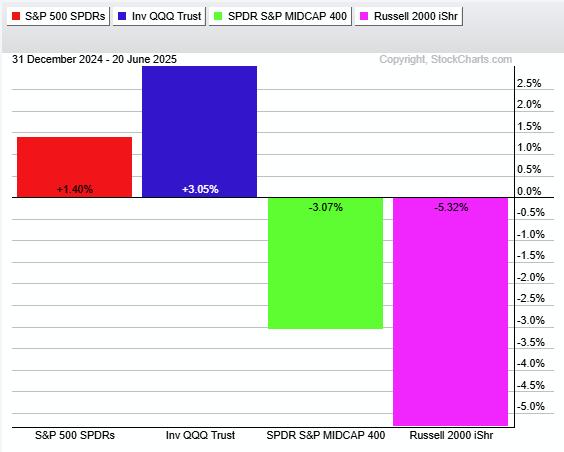
Following the recent market fluctuations, with a sharp decline and a subsequent rally, it’s crucial to examine these movements’ underlying factors. Utilizing relative rotation graphs (RRGs), we can gain insights into the current trends between growth and value stocks and their performance across different size segments. Growth vs Value on Daily RRG The daily RRG clearly prefers growth stocks over ...

The Halloween effect caught up with the stock market! October 31 ended up being a spooky day for investors. Tepid earnings from big tech companies and negative news about Super Micro Computer (SMCI) sent stocks plunging, especially semiconductors (more on this below). Precious metals, which were in a roaring bull rally, also sold off. Gold futures were down 1.84% and ...

As we near the end of October 2024, it’s important to note that the market trends remain quite strong. Despite plenty of short-term breakdowns in key stocks this week, our Market Trend Model remains bullish on all time frames. This tells me to consider this market “innocent until proven guilty” but to always be looking for signs of a potential market reversal. ...

Homebuyers are still on the sidelines, waiting for better mortgage rates, while homebuilders are gearing up for a potentially strong 2025. Despite mortgage rates hitting two-year lows, buyers are holding back, expecting rates and prices to drop further. Here’s the big question: Are we seeing the bottom of a downward cycle about to turn up? In other words, are we ...

When the stock market hesitates to move in either direction, it becomes challenging to identify potential trading candidates. For this reason, it’s a good idea to have a checklist of items to go over during the trading day. One item on my checklist is to run my SCTR (StockCharts Technical Rank, pronounced “scooter”) scan, which looks for stocks and exchange-traded ...

In this exclusive StockCharts video, Joe shows a specific candlestick pattern that, when it develops at the right time, can signal the start of a new upleg. He uses NVDA, MSFT and GLD to explain how this can setup at different times and can give a timely signal to look to enter or in some cases a signal to exit. ...

One of several effective StockCharts tools you can use to spot potential trading or investing opportunities is to check the New Highs panel in Your Dashboard. This feature highlights stocks hitting new highs—from one-month peaks to 52-week or all-time records—giving you a peek at where Wall Street’s capital may be flowing. On Monday morning, the one-month new high list top ...

In this video, Dave digs into five market breadth indicators every investor should track as we navigate a volatile period including Q3 earnings, the US elections, and the November Fed meeting. He breaks down key insights on each of the five charts, talks about why breadth indicators are equal-weighted, and relates all of this back to the most important chart ...

As part of today’s coverage of the Magnificent Seven we remind you when the big mega-caps are reporting and give you are current perspective of each. We also cover all of the Magnificent Seven in the short and intermediate terms with daily and weekly charts. Carl gives us his opinion on where the market is headed and what DecisionPoint signal ...

The secular bull market in stocks has been epic both in duration and extent. The NASDAQ 100 Index illustrates this bull run best of all. Using Wyckoff Method classic trendline construction techniques, the chart below illuminates this secular bull phenomena. The stride of the bull market run is set with three points in 2010 and 2011. Drawing a Demand Trendline ...