
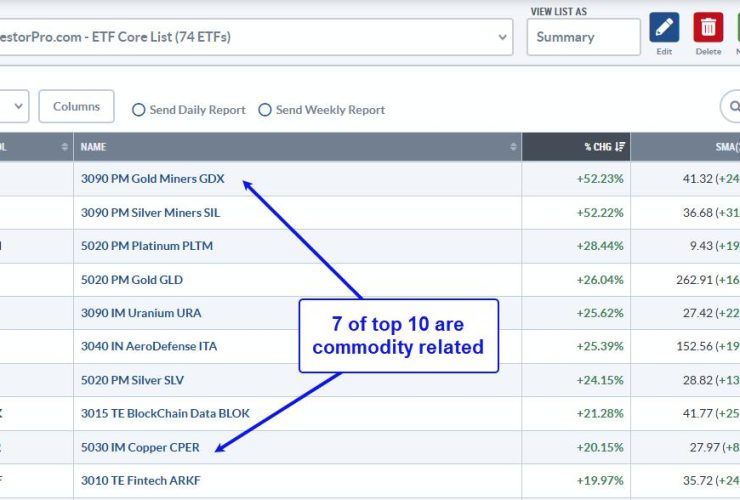
QQQ and tech ETFs are leading the surge off the April low, but there is another group leading year-to-date. Year-to-date performance is important because it includes two big events: the stock market decline from mid February to early April and the steep surge into early June. We need to combine these two events for a complete performance picture. TrendInvestorPro uses ...
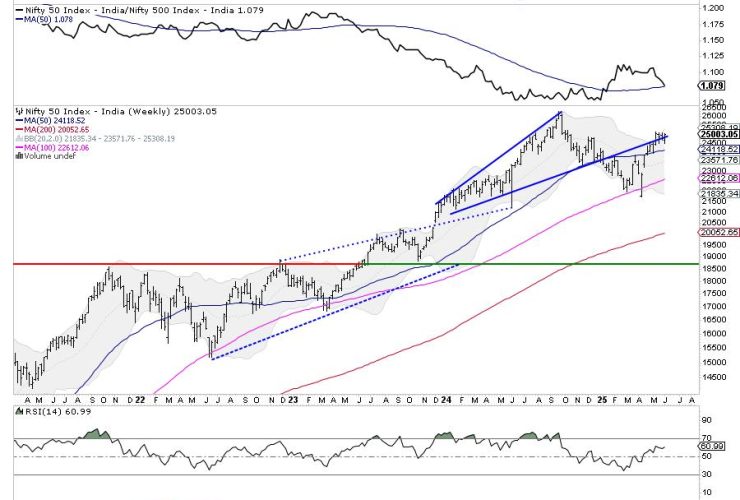
After consolidating for two weeks, the Nifty finally appeared to be flexing its muscles for a potential move higher. Over the past five sessions, the Nifty traded with an underlying positive bias and ended near the week’s high point while also attempting to move past a crucial pattern resistance. The past week saw the Index oscillating in the 527-point range, ...

Stay ahead of the market in under 30 minutes! In this video, Mary Ellen breaks down why the S&P 500 just broke out, which sectors are truly leading (industrials, technology & materials), and what next week’s inflation data could mean for your portfolio. This video originally premiered June 6, 2025. You can watch it on our dedicated page for Mary Ellen’s videos. New ...

This week, we got a smorgasbord of jobs data — JOLTS, ADP, weekly jobless claims, and the nonfarm payrolls (NFP). Friday’s NFP, the big one the market was waiting for, showed that 139,000 jobs were added in May, which was better than the expected 130,000. Unemployment rate held steady at 4.2%, and average hourly earnings rose 0.4% for the month. ...
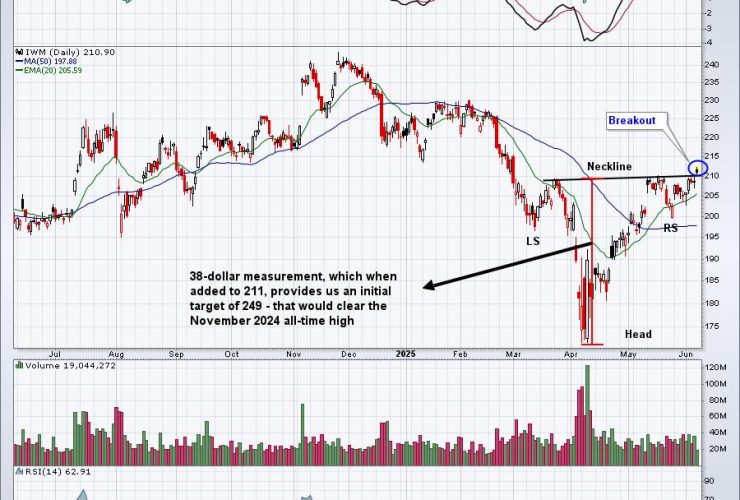
All of our major indices continue to rally off the April 7th, cyclical bear market low. A couple, however, have broken out of key bullish continuation patterns that measure to all-time highs. I’ll focus on one in today’s article. Russell 2000 The IWM is an ETF that tracks the small-cap Russell 2000 and it’s chart couldn’t be much more bullish ...

Silver just hit a 13-year high, breaking above a key resistance level that could ignite a major bull run. Some metals analysts now say a rally to $40 isn’t a long shot, but a matter of time. So, are the odds finally shifting in favor of the bulls? And, more importantly, is now the time to capitalize on silver’s breakout? ...

Most religions of the world have the fundamental beliefs that are strikingly similar to the Ten Commandments. History has taught humanity that life does not seem to work well without such guiding principles. As responsible parents, we should have a parallel foundation of ten life skills that we impart part to our children. Your list will vary from mine, of course, ...
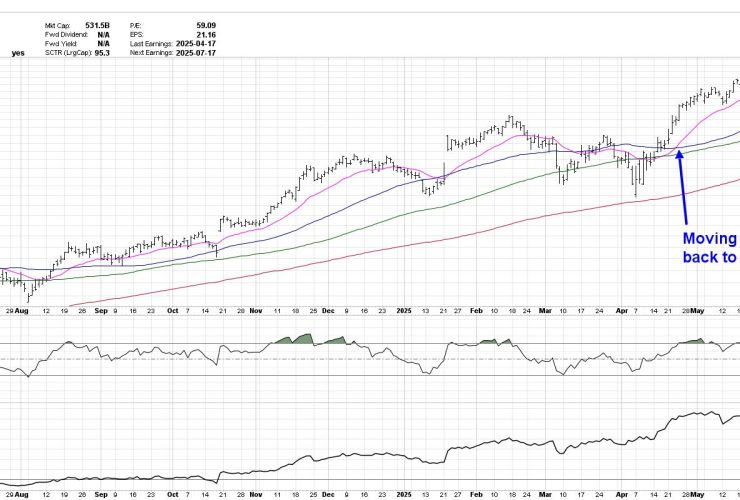
I’m a huge fan of using platforms like StockCharts to help make my investment process more efficient and more effective. The StockCharts scan engine helps me identify stocks that are demonstrating constructive technical configuration based on the shape and relationship of multiple moving averages. Today I’ll share with you one of my favorite scans, called “Moving Averages in Correct Order”, ...

Recently, the S&P 500 ($SPX) has been racking up a good number of wins. Since late April, the index has logged its third winning streak of at least five: a nine-day streak from April 22–May 2 and a six-day streak from May 12–May 19. That makes for a cluster of long winning streaks, which is something that also showed up ...
A lot has happened in the stock market since Liberation Day, keeping us on our toes. Volatility has declined significantly, stocks have bounced back from their April 7 low, and the economy has remained resilient. If you’re still feeling uncertain, though, you’re not alone. The stock market’s in a bit of a “wait and see” mode, going through a period ...