
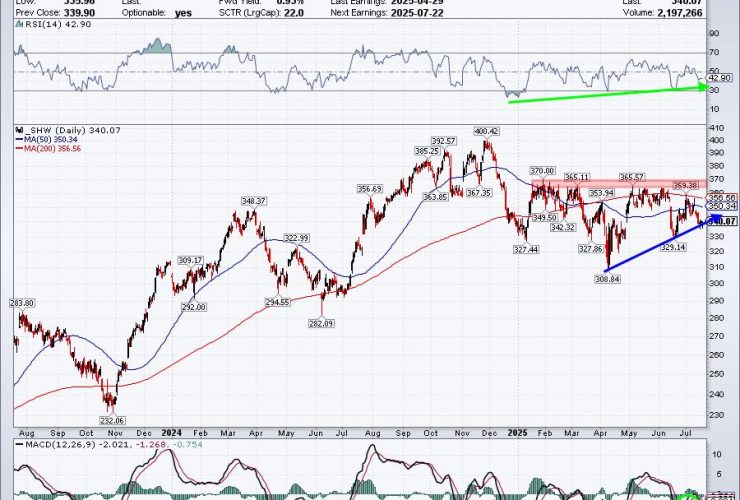
This week, let’s dive into three interesting stocks: a well-known Dow stalwart, a tech giant in a tug of war, and a former Dow member showing signs of revival. Whether you’re looking for opportunity, caution, or something worth watching, there’s a little something here for every thoughtful investor. Sherwin-Williams (SHW): Painting a Better Picture? Sherwin-Williams, Co. (SHW) comes into earnings ...

Join Tom as he covers key inflation data, earnings season highlights, and sector rotation trends. He breaks down recent price action in major indexes like the S&P 500 and Nasdaq, with a close look at the 20-day moving average as a support gauge. Tom spotlights standout industry groups such as gambling, semiconductors, software, and aerospace, and shares charts of top-performing ...

One great habit to develop as an investor is regularly scanning the stock market. Whether you’re checking for stocks that are outperforming a benchmark, gapping up, reversing, or breaking out of a trading range, scanning keeps you in the loop and, importantly, helps you stay sharp and spot potential opportunities early on. During one of our routine scans, one stock ...
There is no denying that the broad markets remain in a resilient uptrend off the April 2025 low. But if there’s one thing I’ve learned from many years of analyzing charts, it’s to remain vigilant during bullish phases. Even though I’ll assume the uptrend is still intact, that doesn’t mean I can stop looking for signs of potential weakness! With ...
From the S&P 500’s pause within a bullish trend, to critical support levels in semiconductors, plus bullish breakouts in Ethereum and Bitcoin, Frank highlights how the market’s recent consolidation may lead to major upside. In this video, Frank explores how to use StockCharts to layer chart annotations, trend indicators, and pattern analysis for stronger evidence-based decisions. He also compares current ...
This week, Joe analyzes all 30 Dow Jones Industrial Average stocks in a rapid-fire format, offering key technical takeaways and highlighting potential setups in the process. Using his multi-timeframe momentum and trend approach, Joe shows how institutional investors assess relative strength, chart structure, ADX signals, and support zones. From Boeing’s triple bottom to Nvidia’s powerful trend, not to mention Microsoft’s ...
Join Grayson as he shares how to streamline your analysis using custom ChartStyles. He demonstrates how to create one-click ChartStyles tailored to your favorite indicators, use style buttons to quickly switch between clean, focused views, and build a chart-leveling system that reduces noise and helps you stay locked in on what matters most. This video originally premiered on July 16, ...
Unlock the power of automated options trading with Tony Zhang, Chief Strategist at OptionsPlay. In this exclusive training, Tony reveals how the OptionsPlay Strategy Center, integrated with StockCharts.com, transforms the way traders find, analyze, and execute options strategies. Follow along as Tony illustrates how to use OptionsPlay and StockCharts eliminate manual scans, reduce time spent digging through option chains, and ...

Relatively healthy earnings reports from the big banks and a June inflation report that came in line with analyst expectations didn’t give the stock market much of a lift, as the S&P 500 ($SPX) and Dow Jones Industrial Average ($INDU) both ended the day lower. The only major index to shine was the Nasdaq Composite ($COMPQ), which closed at a ...
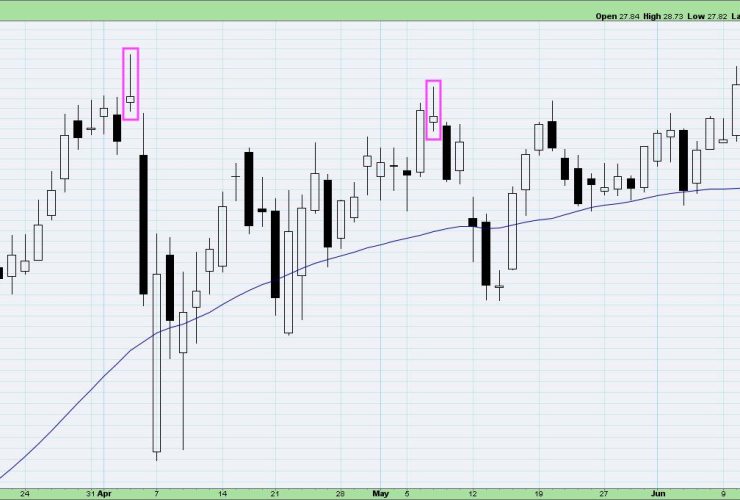
Join Dave as he reviews three common candle patterns traders can use to identify potential turning points. From bullish engulfing patterns to evening star patterns, Dave gives insights on how to leverage these powerful candle signals to anticipate market shifts. He also shows combining candle patterns with conventional technical analysis tools can help improve success rates. This video originally premiered ...